On the exemplified printout in About working with columns, this column is called SALES VALUE% (THIS PERIOD).
- Select the Work with reports menu item.
- On the main panel, select the applicable report and click Columns.
- You access Work with report columns. Click Add.
- On the detail panel, complete the fields as follows:
- Column number
- Enter 11. Note: An index column is always based on the previous column. To prevent a column from being created in-between the index column and the column on which it should be based, you have to assign the index column the next number.
- For example, if the previous column is 10, then the index column must, therefore, be assigned number 11.
- Column heading 1
- Enter “SALES VALUE%”.
- Column heading 2
- Enter “Period”.
- Column type
- Enter 91, which means “Index column”. The value in this column is calculated from the value in the previous column (here it is SALES VALUE) and the total column value. For your information, an extract of the printout is shown below:
- Edit code
- Since the values in this column will be expressed as a percentage, enter edit code 1, which displays the value with two decimals.
Printout example
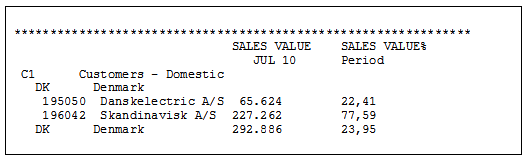
In the example above, “SALES VALUE %” for customer 195050 is calculated as follows:
| Sales value / Total column value: 65.624 / 292.886 = 0,22406
This value is rounded to 0,2241, i.e. 22,41% This means that 22,41% of the sales to customers in Denmark is sold to customer 195050. |
Click OK to update the column and exit the routine.